Week of June 1, 2026
Published every Monday: Get a detailed snapshot of what moved the markets last week—and what to watch this week.
Why stocks are rising despite geopolitical and economic uncertainty.
Following an almost 10 percent decline in oil prices, U.S. markets moved higher again. The Nasdaq Composite and S&P 500 closed at record highs, and the Russell 2000 rallied 1.77 percent. International markets also moved higher. Fixed income markets rallied as inflation concerns eased. The 10-year Treasury yield fell to 4.43 percent.
Weekly Quick Hits
![]()
Friday’s release of the May employment report will offer important insights into the economy’s health.
BEYOND THE HEADLINES:
Why stocks are rising despite geopolitical and economic uncertainty.
War in the Middle East, surging oil prices, accelerating inflation, and leadership transition at the Federal Reserve (Fed) have dominated the news cycle this year. Although that uncertainty may not seem like a backdrop conducive to stronger equity returns, the S&P 500 and Nasdaq Composite reached record highs last week, and the small-cap Russell 2000 Index has rallied more than 11 percent in 2026.
This year is another reminder that, although short-term headlines can move markets, stocks trade on underlying fundamentals over the long term. Corporate earnings have been strong, as accelerating spending on artificial intelligence (AI) infrastructure helps drive growth across multiple sectors involved in the build-out.
Powerful Growth in AI Investment
The expansion of AI infrastructure has helped drive economic growth and stock market returns. AI infrastructure capital outlays are beginning to ramp up. In fact, AI hyperscaler capital expenditures are estimated to increase more than 75 percent this year to more than $700 billion. As a result, companies that benefit from AI investment are likely to remain a key part of the market narrative.
First-quarter earnings season is nearly complete, with 96 percent of index constituents having reported. S&P 500 companies have reported earnings growth of 28.6 percent, more than double the rate analysts expected on March 31. In addition, second-quarter earnings estimates have increased, and full-year estimates have risen 7.6 percent since the war in the Middle East began on February 28.
Impressive Earnings Growth
The so-called Magnificent Seven companies (Alphabet, Amazon, Apple, Meta Platforms, Microsoft, Nvidia, and Tesla) have continued to post impressive earnings growth, which is expected to reach 37 percent in 2026. The 493 other companies in the S&P 500 are also demonstrating strong growth. Analysts expect earnings growth of 18 percent this year, following gains of 4 percent and 10 percent in 2024 and 2025, respectively.
All 11 sectors are expected to post year-over-year earnings growth this year, which should provide a supportive backdrop.
Investors tend to follow improving fundamentals and attractive valuations. Magnificent Seven stocks, which are leading the way in AI adoption, have very strong fundamentals. That has given them the strongest earnings growth profile and continues to attract investors.
The rest of the market has relatively lower valuations and improving fundamentals. Demand for AI infrastructure eventually flows through to industrial companies, materials providers, and power companies. As earnings growth continues to broaden, we anticipate that the sources of portfolio returns will also increase.
We believe the best way to navigate the uncertainties facing the economy—while still benefiting from the strength of AI adoption—is through diversified portfolios with exposure across asset classes, sectors, and geographies.
“This year is another reminder that, although short-term headlines can move markets, stocks trade on underlying fundamentals over the long term.”
Report Releases: May 26–29, 2026
Conference Board Consumer Confidence Index:
May (Tuesday)
Consumer confidence fell last month as views on current economic conditions worsened. Surveyed consumers indicated that a weakening job market was a contributing factor.
- Expected/prior consumer confidence: 92.0/93.8
- Actual consumer confidence: 93.1
Personal Income and Personal Spending:
April (Thursday)
Personal income was unchanged in April, below expectations, while spending rose a solid 0.5 percent.
- Expected/prior personal income monthly change: +0.4%/+0.5%
- Actual personal income change: +0.0%
- Expected/prior personal spending monthly change: +0.5%/+1.0%
- Actual personal spending change: +0.5%
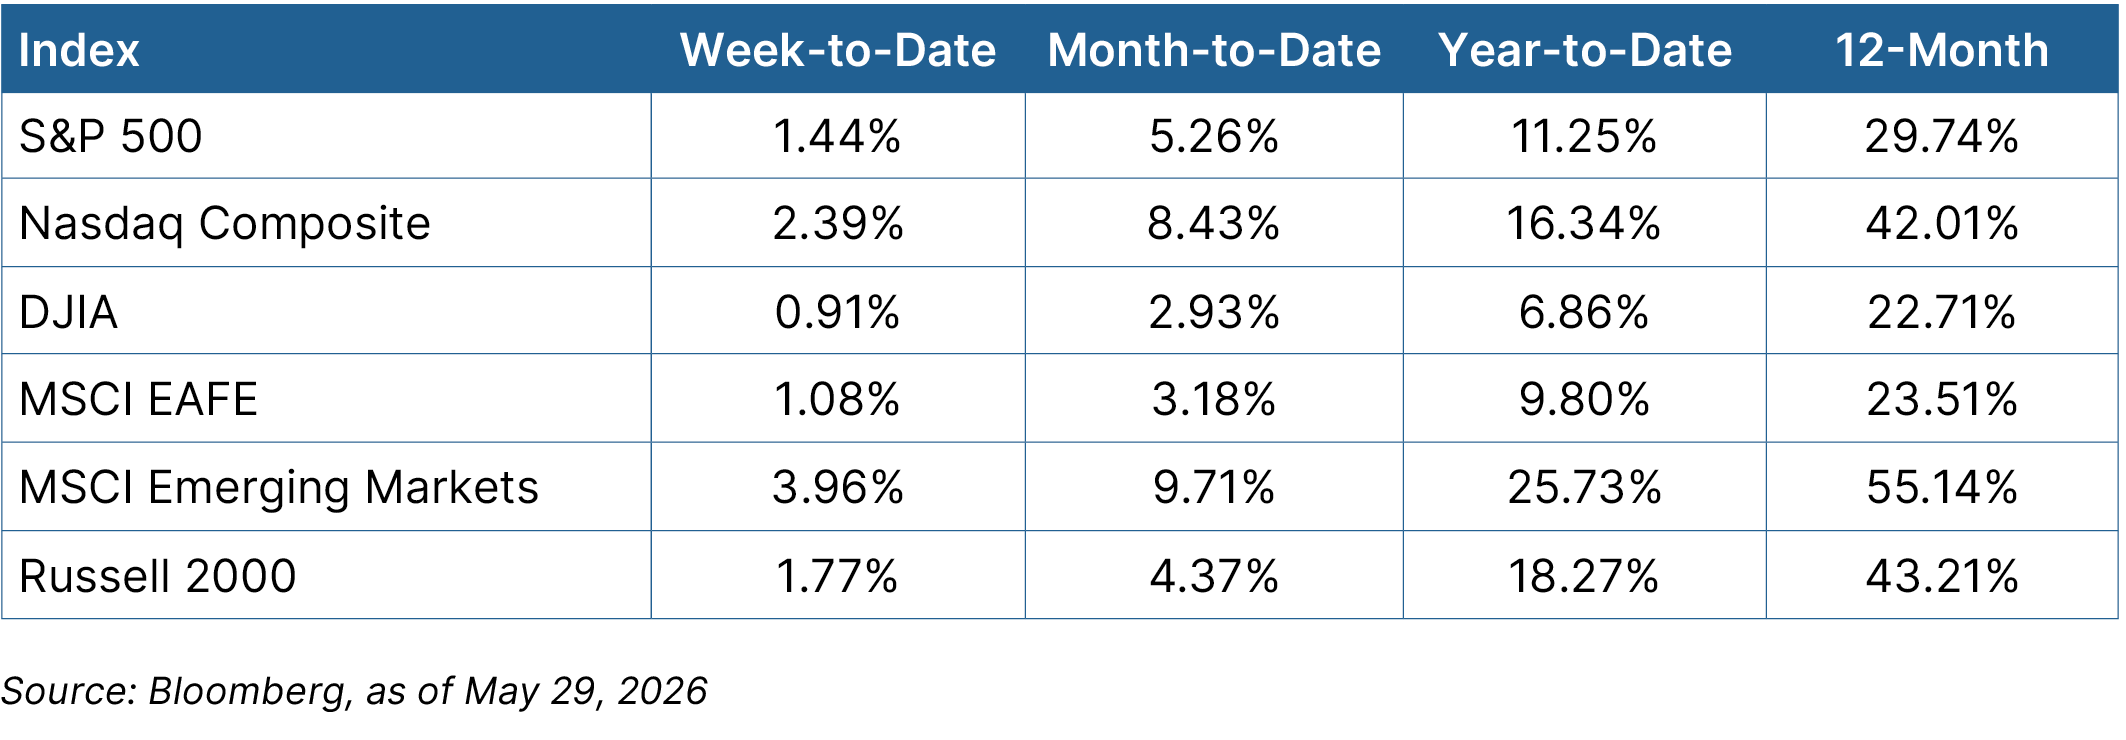
The Takeaway
- Consumer updates were mixed. Confidence declined from the previous month but exceeded expectations.
- Personal income was flat in April, missing expectations, but spending grew a solid 0.5 percent.
Financial Market Data
Equity
U.S. markets rallied across the board again. Continued hopes for a negotiated end to the war in the Middle East led to a 9.6 percent drop in oil prices. The Nasdaq and S&P 500 closed at record highs, and the Russell 2000 rallied 1.77 percent. The technology sector led markets higher, rising 4.56 percent. Unsurprisingly, the energy sector declined 5.43 percent. International markets rose.
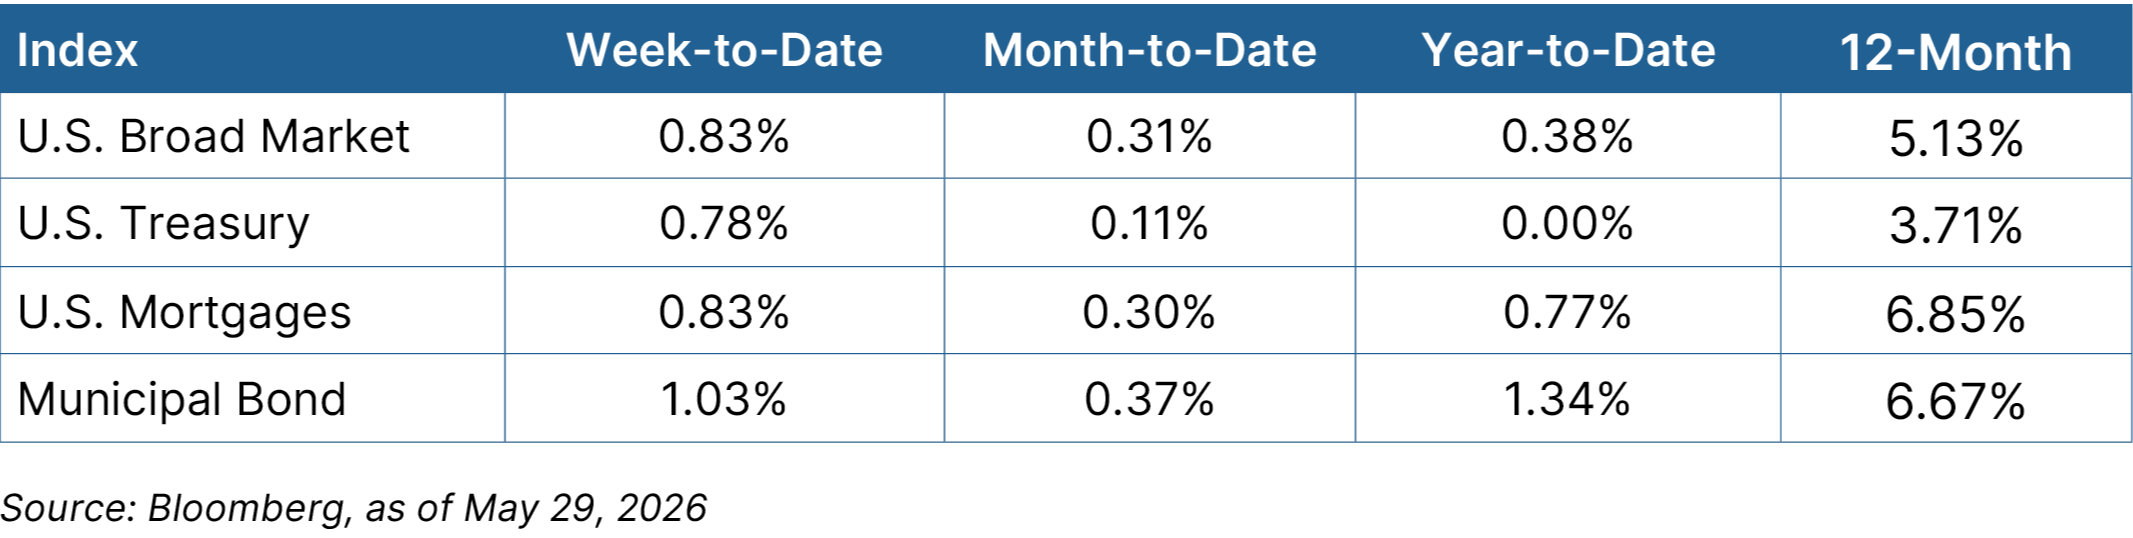
Fixed Income
Fixed income markets rallied on developments in the Middle East. Lower oil prices alleviated some concerns about accelerating inflation. Treasury yields declined across the board, with the 10-year closing at 4.43 percent. High-yield bonds and municipal bonds moved higher.

The Takeaway
- Stocks continued higher on hopes for a deal between the U.S. and Iran. The S&P 500 and Nasdaq closed at record highs. Technology led the market higher, while energy declined.
- Fixed income markets were also higher. The 10-year yield declined, closing at 4.43 percent.
Looking Ahead
The health of the labor market will be in focus this week.
- The week kicks off on Monday with the Institute for Supply Management (ISM) Manufacturing index for May. It’s expected to improve modestly.
- On Wednesday, we’ll see the ISM Services index for May. Economists expect a modest improvement.
- The week wraps up on Friday with the employment report for May. Hiring is expected to slow, with 93,000 new jobs anticipated.
- Earnings reports continue this week, highlighted by Broadcom’s report on Wednesday.
Disclosure: This material is intended for informational/educational purposes only and should not be construed as investment advice, a solicitation, or a recommendation to buy or sell any security or investment product. Diversification does not assure a profit or protect against loss in declining markets, and diversification cannot guarantee that any objective or goal will be achieved. Please contact your financial professional for more information specific to your situation.
Bonds are subject to availability and market conditions; some have call features that may affect income. Bond prices and yields are inversely related: when the price goes up, the yield goes down, and vice versa. Market risk is a consideration if sold or redeemed prior to maturity.
Certain sections of this commentary contain forward-looking statements that are based on our reasonable expectations, estimates, projections, and assumptions. Forward-looking statements are not guarantees of future performance and involve certain risks and uncertainties, which are difficult to predict. All indices are unmanaged and are not available for direct investment by the public. Past performance is not indicative of future results. The S&P 500 is based on the average performance of the 500 industrial stocks monitored by Standard & Poor’s. The Nasdaq Composite Index measures the performance of all issues listed in the Nasdaq Stock Market, except for rights, warrants, units, and convertible debentures. The Dow Jones Industrial Average is computed by summing the prices of the stocks of 30 large companies and then dividing that total by an adjusted value, one which has been adjusted over the years to account for the effects of stock splits on the prices of the 30 companies. Dividends are reinvested to reflect the actual performance of the underlying securities. The MSCI EAFE Index is a float-adjusted market capitalization index designed to measure developed market equity performance, excluding the U.S. and Canada. The MSCI Emerging Markets Index is a market capitalization-weighted index composed of companies representative of the market structure of 26 emerging market countries in Europe, Latin America, and the Pacific Basin. The Russell 2000® Index measures the performance of the 2,000 smallest companies in the Russell 3000® Index. The Bloomberg US Aggregate Bond Index is an unmanaged market value-weighted performance benchmark for investment-grade fixed-rate debt issues, including government, corporate, asset-backed, and mortgage-backed securities with maturities of at least one year. The U.S. Treasury Index is based on the auctions of U.S. Treasury bills, or on the U.S. Treasury’s daily yield curve. The Bloomberg US Mortgage Backed Securities (MBS) Index is an unmanaged market value-weighted index of 15- and 30-year fixed-rate securities backed by mortgage pools of the Government National Mortgage Association (GNMA), Federal National Mortgage Association (Fannie Mae), and the Federal Home Loan Mortgage Corporation (FHLMC), and balloon mortgages with fixed-rate coupons. The Bloomberg US Municipal Index includes investment-grade, tax-exempt, and fixed-rate bonds with long-term maturities (greater than 2 years) selected from issues larger than $50 million. One basis point is equal to 1/100th of 1 percent, or 0.01 percent.
Authored by the Investment Research team at Commonwealth Financial Network®.
© 2026 Commonwealth Financial Network®
Let’s Talk About Your Financial Future
Whether you’re navigating a volatile market or preparing for the future, we’re here to help.